
짜리몽땅 매거진
[SQL] 코멘토 프로젝트 - 데이터 분석 보고서 작성하기+Redash 시각화 본문
Northwind 데이터 분석 보고서 작성
Redash에서 Northwind 데이터에 대한 가설을 3개 정하고, 그 가설에 대한 핵심 지표 및 보조 지표를 설정한 뒤, 그 지표를 분석해 가설에 대한 분석 보고서 작성해보자.
보고서 순서 : '가설 수립 > 가설을 검증하기 위한 지표 선정 > 지표 측정 및 분석 > 분석 결과 및 결론(인사이트)'
0. 지표에 대한 이해
지표란 기업에서 어떤 대상(서비스, 프로덕트, 사람 등)의 성과 평가를 하기 위해 사용되는 기준을 말한다. 예를 들어 새로 진행한 온라인 광고의 성과 평가를 위해 ‘노출수, CTR(Click-Through Rate, 클릭률), CVR(Conversion Rate, 전환율)’ 등을 본다고 했을 때 각각은 온라인 광고 성과 평가를 위한 지표가 된다.
보통은 정해져있는 지표가 있지만 가끔은 새로 지표를 정의해야 할 수도 있다. 혹은 기존에 있는 지표에 대한 개선 아이디어를 도출하는 업무를 맡기도 한다. 그런 상황을 대비해서 좋은 지표가 무엇인지 고민해 볼 필요가 있다.
- 수치로 나타낼 수 있어야 한다 - 숫자로 표현할 수 있는 측정 가능한 지표만이 객관적이고 명확한 의미를 가질 수 있다.
- 절대적이기보다 상대적이어야 한다 - 이번달 신규 가입자 수가 1만명이라고만 하면 이게 많은지 적은지 알 수 없다. 전월 가입자수는 5천명 이라는 기준점을 제시해주거나, 전월 대비 신규가입자수 증가율이 200%이다 와 같이 표현하는 것이 좋다.
- 핵심을 파악할 수 있는 최소한의 지표만 남겨야 한다 - 지표가 너무 많으면 관리하기도 어렵고, 지표를 보면서 제대로 된 인사이트를 얻기가 힘들다. 서비스 현황을 파악할 수 있는 핵심 지표 몇가지만 정하는 것이 중요하다.
1. 분석 보고서 작성하기
Redash에서 'northwind' 및 'northwind_large' 데이터베이스를 기준으로 분석하였습니다.
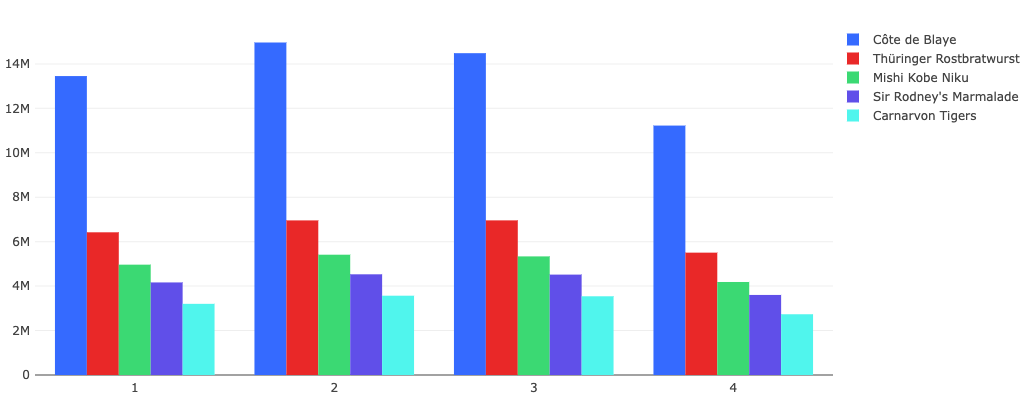
[분기별, 제품별 총 매출]
(1) 가설 수립 : 4분기에는 연말연시 효과로 전체적인 매출이 타 분기에 비해 높을 것이다.
(2) 가설 검증 지표 : 분기별, 제품별 총 판매 금액(각 제품별 단가 * 판매 수량)
(3) 지표 측정 및 분석
select a.`분기`, a.ProductName, a.`매출액`
from (select quarter(OrderDate) as '분기', Product.ProductName, sum(OrderDetail.Quantity * OrderDetail.UnitPrice) as '매출액' from OrderDetail
    inner join Orders on Orders.Id = OrderDetail.OrderId
    inner join Product on Product.Id = OrderDetail.ProductId
    where quarter(OrderDate) = 1
    group by quarter(OrderDate), ProductName
    order by sum(Quantity * UnitPrice) desc
    limit 5) as a

union

select b.`분기`, b.ProductName, b.`매출액`
from (select quarter(OrderDate) as '분기', Product.ProductName, sum(OrderDetail.Quantity * OrderDetail.UnitPrice) as '매출액' from OrderDetail
    inner join Orders on Orders.Id = OrderDetail.OrderId
    inner join Product on Product.Id = OrderDetail.ProductId
    where quarter(OrderDate) = 2
    group by quarter(OrderDate), ProductName
    order by sum(Quantity * UnitPrice) desc
    limit 5) as b

union

select c.`분기`, c.ProductName, c.`매출액`
from (select quarter(OrderDate) as '분기', Product.ProductName, sum(OrderDetail.Quantity * OrderDetail.UnitPrice) as '매출액' from OrderDetail
    inner join Orders on Orders.Id = OrderDetail.OrderId
    inner join Product on Product.Id = OrderDetail.ProductId
    where quarter(OrderDate) = 3
    group by quarter(OrderDate), ProductName
    order by sum(Quantity * UnitPrice) desc
    limit 5) as c

union

select d.`분기`, d.ProductName, d.`매출액`
from (select quarter(OrderDate) as '분기', Product.ProductName, sum(OrderDetail.Quantity * OrderDetail.UnitPrice) as '매출액' from OrderDetail
    inner join Orders on Orders.Id = OrderDetail.OrderId
    inner join Product on Product.Id = OrderDetail.ProductId
    where quarter(OrderDate) = 4
    group by quarter(OrderDate), ProductName
    order by sum(Quantity * UnitPrice) desc
    limit 5) as d
(4) 분석 결과 및 결론
- 2, 3분기에 매출이 증가하는 것을 보아 계절적 요인과 관련이 있어보인다. 여름철에 사람들이 더 많은 제품을 구매할 가능성이 있다.
- 4분기의 매출 감소는 휴가철로 인해 비즈니스 활동이 둔화된 결과일 수 있다.
[분기별, 배송지별 총 매출]
(1) 가설 수립 : 특정 지역이 다른 지역보다 매출이 더 높을 것이다.
(2) 가설 검증 지표 : 분기별, 배송지별 총 판매 금액(각 제품별 단가 * 판매 수량)
(3) 지표 측정 및 분석
select a.`분기`, a.`매출액`, ANY_VALUE(a.ShipAddress) as '배송 지역' ,  a.ProductName as '상품'
from (select quarter(OrderDate) as '분기', Orders.ShipAddress ,Product.ProductName, sum(OrderDetail.Quantity * OrderDetail.UnitPrice) as '매출액' from OrderDetail
    inner join Orders on Orders.Id = OrderDetail.OrderId
    inner join Product on Product.Id = OrderDetail.ProductId
    where quarter(OrderDate) = 1
    group by quarter(OrderDate), Orders.ShipAddress, Product.ProductName
    order by sum(Quantity * UnitPrice) desc
    limit 5) as a

union

select b.`분기`, b.`매출액`, ANY_VALUE(b.ShipAddress) as '배송 지역' ,  b.ProductName as '상품'
from (select quarter(OrderDate) as '분기', Orders.ShipAddress ,Product.ProductName, sum(OrderDetail.Quantity * OrderDetail.UnitPrice) as '매출액' from OrderDetail
    inner join Orders on Orders.Id = OrderDetail.OrderId
    inner join Product on Product.Id = OrderDetail.ProductId
    where quarter(OrderDate) = 2
    group by quarter(OrderDate), Orders.ShipAddress, Product.ProductName
    order by sum(Quantity * UnitPrice) desc
    limit 5) as b

union

select c.`분기`, c.`매출액`, ANY_VALUE(c.ShipAddress) as '배송 지역' ,  c.ProductName as '상품'
from (select quarter(OrderDate) as '분기', Orders.ShipAddress ,Product.ProductName, sum(OrderDetail.Quantity * OrderDetail.UnitPrice) as '매출액' from OrderDetail
    inner join Orders on Orders.Id = OrderDetail.OrderId
    inner join Product on Product.Id = OrderDetail.ProductId
    where quarter(OrderDate) = 3
    group by quarter(OrderDate), Orders.ShipAddress, Product.ProductName
    order by sum(Quantity * UnitPrice) desc
    limit 5) as c

union

select d.`분기`, d.`매출액`, ANY_VALUE(d.ShipAddress) as '배송 지역' ,  d.ProductName as '상품'
from (select quarter(OrderDate) as '분기', Orders.ShipAddress ,Product.ProductName, sum(OrderDetail.Quantity * OrderDetail.UnitPrice) as '매출액' from OrderDetail
    inner join Orders on Orders.Id = OrderDetail.OrderId
    inner join Product on Product.Id = OrderDetail.ProductId
    where quarter(OrderDate) = 4
    group by quarter(OrderDate), Orders.ShipAddress, Product.ProductName
    order by sum(Quantity * UnitPrice) desc
    limit 5) as d
(4) 분석 결과 및 결론
- 고객 밀집: "Obere Str. 57"은 고객이 많이 밀집된 지역이거나, 매우 중요한 고객(이 위치한 장소일 가능성이 크다. 이는 해당 지역에 대한 집중적인 마케팅과 판매 노력이 필요함을 시사한다.
- 주요 고객: 이 주소가 주요 고객의 본사나 대형 구매처일 가능성이 있다. 해당 고객과의 관계를 더욱 강화하는 전략이 필요하다.

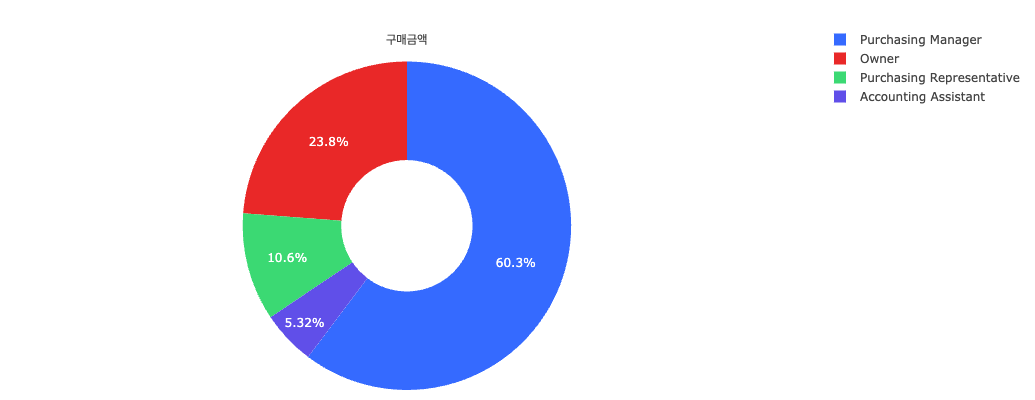
[고객 직업별 구매액]
(1) 가설 수립 : 구매 유통을 담당하는 사람의 구매액이 가장 높을 것이다.
(2) 가설 검증 지표 : 고객 직업별 구매 금액(각 제품별 단가 * 구매량)
(3) 지표 측정 및 분석
select  c.job_title, sum(od.quantity * od.unit_price) `구매금액` from orders o
left join order_details od
on o.id = od.order_id
left join customers c
on c.id = o.customer_id
group by c.job_title
order by  `구매금액` desc
(4) 분석 결과 및 결론
- 구매 관리자와 소유주는 구매 결정권을 가지고 있는 직책이다. 이들이 높은 구매액을 기록하고 있다는 것은 이 직책의 사람들이 귀사의 주요 고객층임을 나타낸다.
- B2B 시장 강세: 구매 관리자와 소유주는 B2B 거래에서 중요한 역할을 한다다. 이는 northwind의 제품이 B2B 시장에서 강세를 보이고 있음을 시사한다.
'Data > SQL' 카테고리의 다른 글
| [SQL] Google Analytics 웹사이트 접속 및 사용 분석 (2) | 2024.09.07 |
|---|---|
| [SQL] 코멘토 프로젝트 - 인사이트가 한 눈에 들어오는 대시보드 만들기 (1) | 2024.06.11 |
| [SQL] solvesql 코딩테스트 연습10 (0) | 2024.06.04 |
| [SQL] 코멘토 프로젝트 - SQL을 활용해 다양한 지표 추출하기 (0) | 2024.05.28 |
| [SQL] solvesql 코딩테스트 연습9 (0) | 2024.05.27 |


